Hello Internet. We have seen how devices gather data from the field and send it over to the enormous cloud for storage. However stored data is of little use for a person who is trying to gather meaningful insight from it. The data sent over is raw data and is very difficult for the ordinary user to make sense. This is where querying and reporting comes in. Extraction of volumes of historic data and presenting them in the form of reports is what puts value into the painstaking collected data.
Here is a pyramid which shows data and how it is distilled into wisdom.
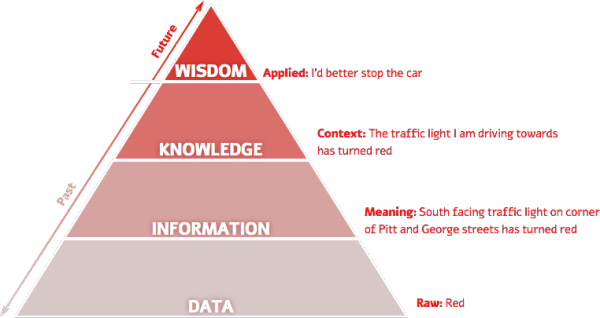
The basic strategy to convert huge data into wisdom: Divide and Conquer
Because of the sheer volume of data, it is smart to first break down the gathered data into manageable pieces and then convert those pieces into something meaningful. A single system generally has no means to crunch all the data in one bite on its own. Here are some of the strategies and technologies used to achieve conversion.

While making real time metrics, it is important to plan out the metric well in advance since it would be very difficult to make a new metric on the fly due to the amount of crunching needed to bring the data upto date and then keep up with real time.
Another important point with real time data is that it must be simple enough to be derived in a very short time. E.g. Total online users at the moment is simpler to derive than total online users who are between 26-30 years of age residing in London. Not only does such conditional derived metric need more processing, but one would then have to make real time metrics for each such age group & city, which will quickly eat up the memory. Such reports are better off derived periodically and stored on a higher volume storage such as a disk to be fetched later.


 Over the past few blogs, we have seen how IoT works from the sensor data gathering phase to generating reports on the cloud. From the next post, we will see popular posts related to IoT, that I will curate from over the Internet.
Here is a pyramid which shows data and how it is distilled into wisdom.
The basic strategy to convert huge data into wisdom: Divide and Conquer
Because of the sheer volume of data, it is smart to first break down the gathered data into manageable pieces and then convert those pieces into something meaningful. A single system generally has no means to crunch all the data in one bite on its own. Here are some of the strategies and technologies used to achieve conversion.
Crunch the data as it comes
This is the most preferred strategy when it comes to real time reports. The data that is coming in is crunched live into different types of outputs. Since the data generally comes in really rapidly (also called firehose input), the crunching system must have a high amount of processing power. Each input is generally processed into fifty or hundred types of real time metric, such a number of users currently online, number of active transactions, live incremental count of progress, etc. Also since these metrics are written live, it is a big NO-NO to store such rapidly changing data into disk storage such as hard disk. The live data must reside in faster memory such as solid state device or RAM. Multiple copies and backups are desired since such types of memory devices are typically temporary and lose the data when electricity is stopped or if the memory happens to be disconnected. Apart from hardware, it is necessary to use software which must be capable of accessing data & databases in-memory rather than from the disk. Traditional databases such as Oracle & MySQL do not have a good support for memory databases due to their heavy memory footprint and overhead. Enter Redis. Redis is one of the most successful in-memory data storage mechanisms and can support voluminous amounts of reads/writes per second. Other solutions such as Cassandra can make databases both on disk & in-memory.While making real time metrics, it is important to plan out the metric well in advance since it would be very difficult to make a new metric on the fly due to the amount of crunching needed to bring the data upto date and then keep up with real time.
Another important point with real time data is that it must be simple enough to be derived in a very short time. E.g. Total online users at the moment is simpler to derive than total online users who are between 26-30 years of age residing in London. Not only does such conditional derived metric need more processing, but one would then have to make real time metrics for each such age group & city, which will quickly eat up the memory. Such reports are better off derived periodically and stored on a higher volume storage such as a disk to be fetched later.
Crunch data periodically
For periodic reports such as daily reports or monthly reports, this is the most efficient strategy. Since such reports are not required at real time, one can schedule them to be generated at intervals when the traffic is either very low or non-existent, such as midnight every day. Periodic data are generally summaries and do not need to store each & every field that is in the main transactional databases. For this reason, they are kept seperate from the transactional databases and even use different technologies such as hierarchy databases to show metrics grouped under various categories. The most common databases for periodic reports are MongoDB and Cassandra. The data is generally stored on disk or on a long term storage such as Amazon EBS, S3 or Glacier, which are cloud storage offerings, so that the business does not need to maintain its own storage disks for storing historic data.Ad hoc reporting: Use multiple processing units to process blocks of data parallely
Despite all the careful planning, there will be instances when a business will need to generate reports based on adhoc requests. In such cases, it may be needed to call upon the business's entire history of data since the day it started operations. Such reporting is daunting and the business should ask for a reasonable amount of time to return the results to the stakeholder which raised the request. In the meantime, the business can use the following methodology to generate the report. Divide the data into manageable pieces. Set up a sizeable number of processing units to work on each piece. Start parallely processing each piece to gain outputs per piece. Gather the piecemeal output from each processor and join them up to get the final result. The above steps have one name in the industry: Map-Reduce. Mapping is the process of dividing and assigning pieces to processing units, whereas reduction is the process of gathering piecemeal results and combining them to get one result. The enormous data from which to obtain the result is called Big Data. The most popular technology used for Map-Reduce is currently Hadoop. Other company offering such Google Big Query and Amazon Elastic MapReduce are also gaining traction.